Zachary S Farley, MPH
|| Doctoral Candidate ||
Prevention Science
|| University of Oregon ||

Biography
Zach Farley, MPH is a doctoral candidate in Prevention Science at the University of Oregon, where he is currently completing his dissertation requirements. He has a background in exercise science (BS) and has earned an MPH with a focus in chronic disease prevention. Zach also has experience in the public health workforce, where he helped oversee COVID-19 data management and reporting at a local health department in Chattanooga, Tennessee. His research interests include examination of the the environmental and psychological dynamics driving health behaviors in the prevention of chronic disease and the promotion of a healthy lifestyle. Zach has worked as a summer fellow in the Health Behaviors Research Branch at the National Cancer Institute, coordinated community-based participatory research interventions to promote physical activity and nutrition in school-aged youth, and has engaged in research examining the influence of nature exposure on sleep, physical activity & sedentary behaviors among adolescents.
Enhancing the Health of Communities Through Understanding, Education & Research

Education
University of Tennessee at Chattanooga

MPH, 2020
Mentors:
- Dr. Andrew Bailey
- Dr. Kara Hamilton
- Dr. Gregory Heath
BS - Exercise Science, 2017
University of Oregon

PhD(c)- Prevention Science (2025)
Special Area: Community Health Promotion
Specialization: Educational Data Science
Mentor: Dr. Elizabeth Budd

Research Interests

Health Promotion

Physical Activity

Nature Exposure & Engagement

Health Equity & Justice

Community & School-Based Health

Research is formalized curiosity. It is poking and prying with a purpose.
~ Zora Neale Hurston
Journal Articles

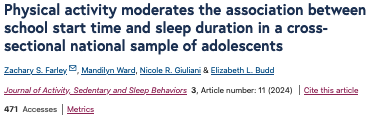
- Farley, Z.S., Ward, M., Giuliani, N.R., Budd, E.L. Physical activity moderates the association between school start time and sleep duration in a cross-sectional national sample of adolescents. JASSB 3, 11 (2024). https://doi.org/10.1186/s44167-024-00050-y
- Budd, E., Castro, E., Terral, H., Farley, Z., Kelly, N. (Under Review, 2024). Narrative review of the evidence on physical activity prescriptions for youth. Under Review in the Journal of Preventive Medicine.
- Hamilton, K.C., Powell, M.P., Howard-Baptiste, S., Farley, Z.S., Hahn, K.J., Easley, E.F., Graham, M.J., Reid, E.C. (Under Review, 2024). The MANE program: A community-based after-school program designed to promote physical activity and nutrition. Under Review in the Journal of Evaluation and Programming.
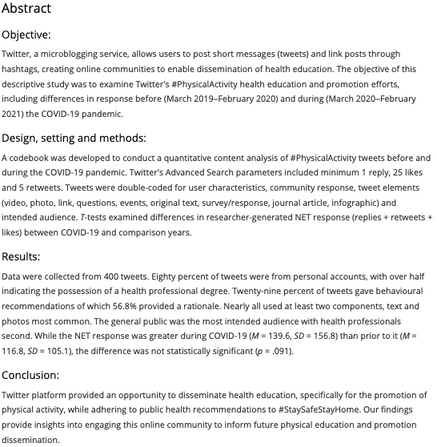
- Farley, Z. S., McDonough, K., Richards, E. A., & Smock, C. R. (2023). Health education and promotion of #PhysicalActivity on Twitter before and during COVID-19. Health Education Journal, 82(3), 286-296. https://doi.org/10.1177%2F00178969231154076
- Zarate, J., Amezcua, A., Ramos, A. O., Linares, J., Seals, B., Farley, Z. S., & Sanchez, A. (2023). Voices of fear and uncertainty: Exploring the employment struggles of female DACA recipients. Journal of Employment Counseling. https://doi.org/10.1002/joec.12220

Oral Presentations
- Farley, Z., Castro, E., Kelly, N., Budd, E. (2024, March 25-28). Use of a novel measure of nature exposure in community-based physical activity research [Speed Talk]. Active Living Conference. Chattanooga, TN, USA.
- Farley, Z.S., Ward, M., Budd, E., Giuliani, N.R. (2023). Delayed school start time and increases physical activity are associated with more sleep in a national sample of US adolescents. Oral presentation at the American Public Health Association 2023 Annual Meeting, Physical Activity Section, Physical Activity Among Children session, Atlanta, GA (November 11-16, 2023).
- Awarded Best Student Oral Presentation, Physical Activity Section, American Public Health Association
- Smock, C., Farley, Z.S., Richards, E., McGloin, A.R., Aleman Villegas, S. (2023). Health education and promotion of #saferoutestoschool for parent and child #physicalactivity on Twitter. Oral presentation at the American Public Health Association 2023 Annual Meeting, Physical Activity Section, Physical Activity Among Children session, Atlanta, GA (November 11-16, 2023).
- Metcalfe, R., Cheng, Y., Clark, M., Farley, Z.S., Reino Santamaria, C., DeGarmo, D. (2022). Prenatal Program Cultural Tailoring, Racial Match with Service Provider, and Paternal Involvement as Predictors of Infant Health Outcomes for Two Cohorts of Racially Marginalized, Pregnant Adolescents. Society for Prevention Research Cup Team Oral Presentation at Society for Prevention Research 2022 Annual Meeting, Seattle, WA (June 2022).
Poster Presentations
- Castro, E., Farley, Z. S., & Budd, E. L. (2023). Psychometric properties of a parent-report physical literacy measure (PLAYparent) and associations with children’s emotional and behavioral health. Accepted for poster presentation at the Annual Conference of Western Society for Physical Education of College Women, November 16 – 18, Pacific Grove, CA.
- Farley, Z.S., McDonough, K., Smock, C., Richards, E. (2022). Characterizing the #physicalactivity community on Twitter before and during COVID-19. Poster presentation at the American Academy of Health Behavior 2022 Annual Meeting, Key Largo, FL (March 13-16, 2022).
- Julian, A. K., Farley, Z.S., Beach, A., & Perna, F. M. (2020). Do-It-Yourself Sunscreen Tutorials on YouTube. Poster presentation at American Academy of Cancer Research 2020 Conference, Cancer Epidemiology Biomarkers & Prevention (April 22-24, 2020 [Virtual]).
- Farley, Z.S., Perna, F., Holman, D., Berrigan, D., Eck, R. (2019). Alcohol and sunburn: A national survey. Poster presentation at the National Cancer Institute’s, Division of Cancer Control and Population Science’s Summer Symposium & an Oral session presented at HBRB All Hands., Rockville, MD (August 2019).
- Farley, Z.S., Bailey, A. (2019). Examining the urban walking brain: Promoting restorative community environments. Poster presentation at Tennessee Public Health Association’s 2019 Annual Educational Conference, Franklin, TN (September 11-13, 2019).

KNOWLEDGE
Establishing foundational knowledge to enhance understanding and confidence of subject matter.
ENGAGEMENT
Engaging students in collaborative critical thinking opportunities to promote engagement with diverse perspectives and deepen conceptual analysis.
CURIOSITY
Fostering curiosity throughout the learning process to drive further exploration and growth; Asking questions is how we find answers.
Teaching Philosophy: Three Core Tenets
Teaching Philosophy:
Building Relationships With Students
I aim to catalyze students' growth and self-discovery by endeavoring to meet students where they are in their educational journey, acknowledging the diversity of their backgrounds and experiences. I operate from the belief that student-centered learning, inclusivity, and mutual understanding are paramount in building relationships with my students. I actively seek feedback from throughout the academic term to ensure that my teaching methods are responsive to students’ needs and learning styles. I prioritize fostering an environment where students feel empowered to share their thoughts and insights, enabling me to continually enhance my instructional practices to better serve them. Demonstrating a commitment to lifelong learning, I model humility in acknowledging what I do not know and engage in active problem-solving alongside my students. I emphasize the value of diverse perspectives, encouraging respectful challenges to students' own beliefs and those of their peers.
Teaching Philosophy:
Discussion & Collaboration Guidelines
I emphasize the value of diverse perspectives, encouraging respectful challenges to students' own beliefs and those of their peers. To scaffold class discussions and discourse, and to uphold the values of justice, responsibility, equality, respect, and integrity, I integrate the Ubuntu principles into my syllabi:
- Showing moral respect to all;
- Recognizing the worth of instructors and peers – even those with differing beliefs;
- Prioritizing the humanity of all individuals whom are equally deserving of dignity and respect.
These serve as the foundation for the cultivation of an inclusive class culture that promotes knowledge attainment and engagement in collaborative critical thinking, and fosters curiosity in the complexity of the shared human experience.
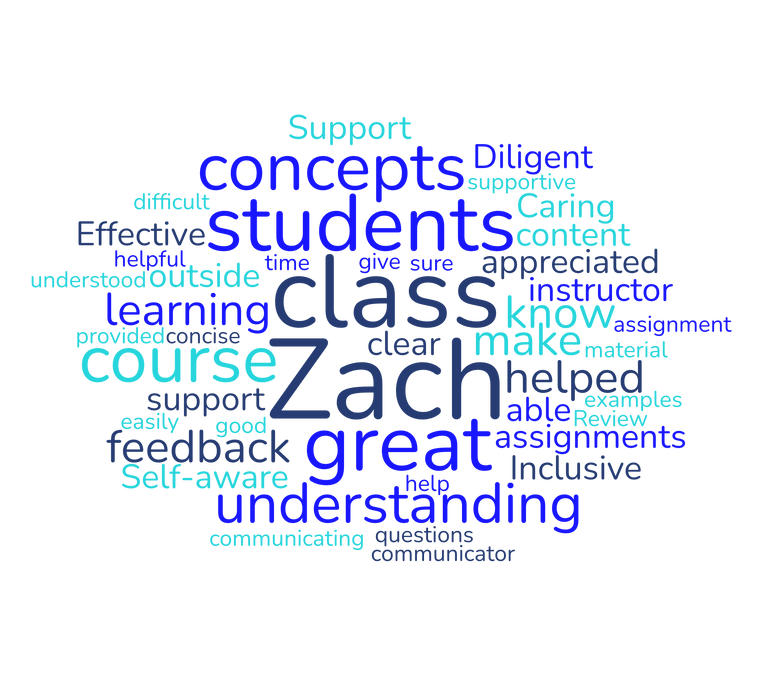
Student Feedback From Course Evaluations
Scientific Analysis and Methods in Family and Human Services (2024)
Enrollment: 60 Undergraduate Students (Junior & Senior)
Q: What specifically about the support from the instructor helped your learning?
- “Zach goes out of his way to consistently give clear and concise communication. Whether that be the material we are learning, giving appropriate examples to give us an idea of what is expected, or making sure to emphasize what we should know or not. He provides a lot of support outside of class hours, and always make this supportive effort known to the students in the class.”
- “Zach was an incredibly supportive instructor that was clearly very invested in the success of the students in the course. He made sure that we understood the topics before moving on. He also did a great job of letting us know what depth of understanding would be necessary for future careers or grad school endeavors.”
- “...Zach is such an outstanding teacher. A true natural. Thank you, Zach! This was a really hard class to teach, and you worked really hard and did a really great job.”
- “Zach is such a great instructor and he is so understanding. I asked for his help with clarity on our final assignment and he definitely gave amazing feedback. He’s really good at what he does.”
- “The instructor really took the time and effort to be helpful and support the students in this class which was surprising and very helpful.”
Q: What specifically about instructor communication helped your learning?
- “Zach is a great communicator who helps everyone understand the concepts better. Goes above and beyond.”
- “Zach is a very clear, thoughtful communicator. He speaks to students with respect and genuine care and is diligent about updating us on changes to course material. His delivery of content is concise and engaging.”
- “Zach is great at communicating lessons and makes them engaging, especially through some of those confusing moments when learning new concepts during lecture.”
- “I really liked the way Zach went above and beyond to make course content relevant to students. He did so much in this course and I really appreciated it.”


Professional Membership & Service
- American Public Health Association - Member (2019-Pres)
- Student Social Chair, Physical Activity Section (2019-2021)
- Social Chair, Physical Activity Section (2022-2023)
- Abstract Reviewer, Physical Activity Section (2019-Pres)
- Society for Prevention Research - Member (2021-Pres)
- American College of Sports Medicine - Member (2023-Pres)
- Global University Sports Network - Representative (2024)
- University Ambassador
Professional & Translateable Skills
- Educational Data Science
- Data Cleaning
- Data Visualization
- Machine Learning
- Statistical Analysis
- Sentiment Analysis
- RStudio & SPSS
- Geographic Information Systems (ArcGIS)
- Walkability Indices
- Spatial Analysis
- Health Mapping
- Quantitative Methods
- HLM, LPA, MVMM
- Community Outreach
- Research & Event Coordination
- Project Management
- Actigraphy Accelerometers
- Federal Database Management Systems (NBSS)
- Qualtrics
- Science Communication & Dissemination
- Public Health Advocacy & Justice
- Mentorship, Advisement, and Motivation


On the Job Market
Zachary S Farley, MPH
Anticipated Graduation: June 2025

zsf@uoregon.edu


Zach Farley is a dedicated educator, public servant, and researcher focused on promoting health, education, and well-being. Although he is primed for a position in higher education, he is also open to other positions in the public, private, and government sectors.

My Work
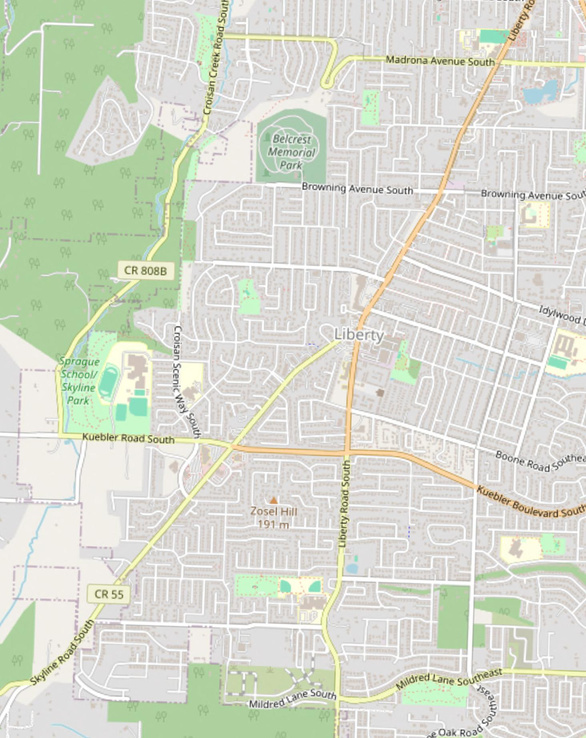
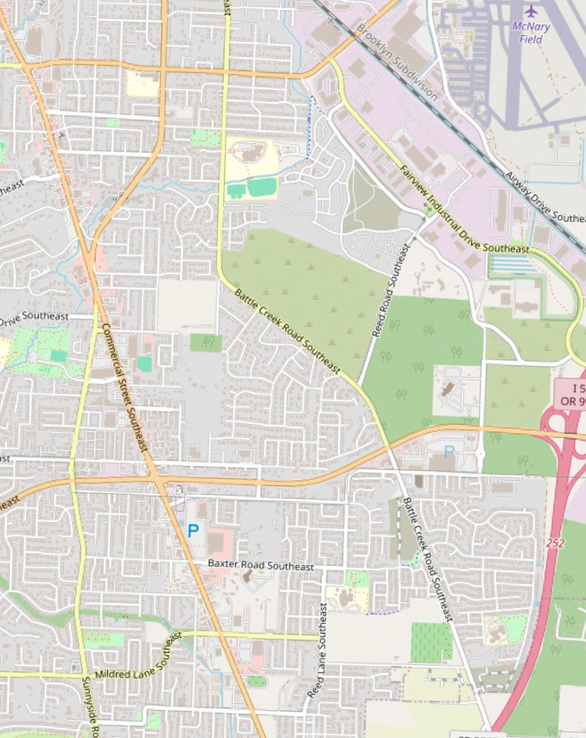
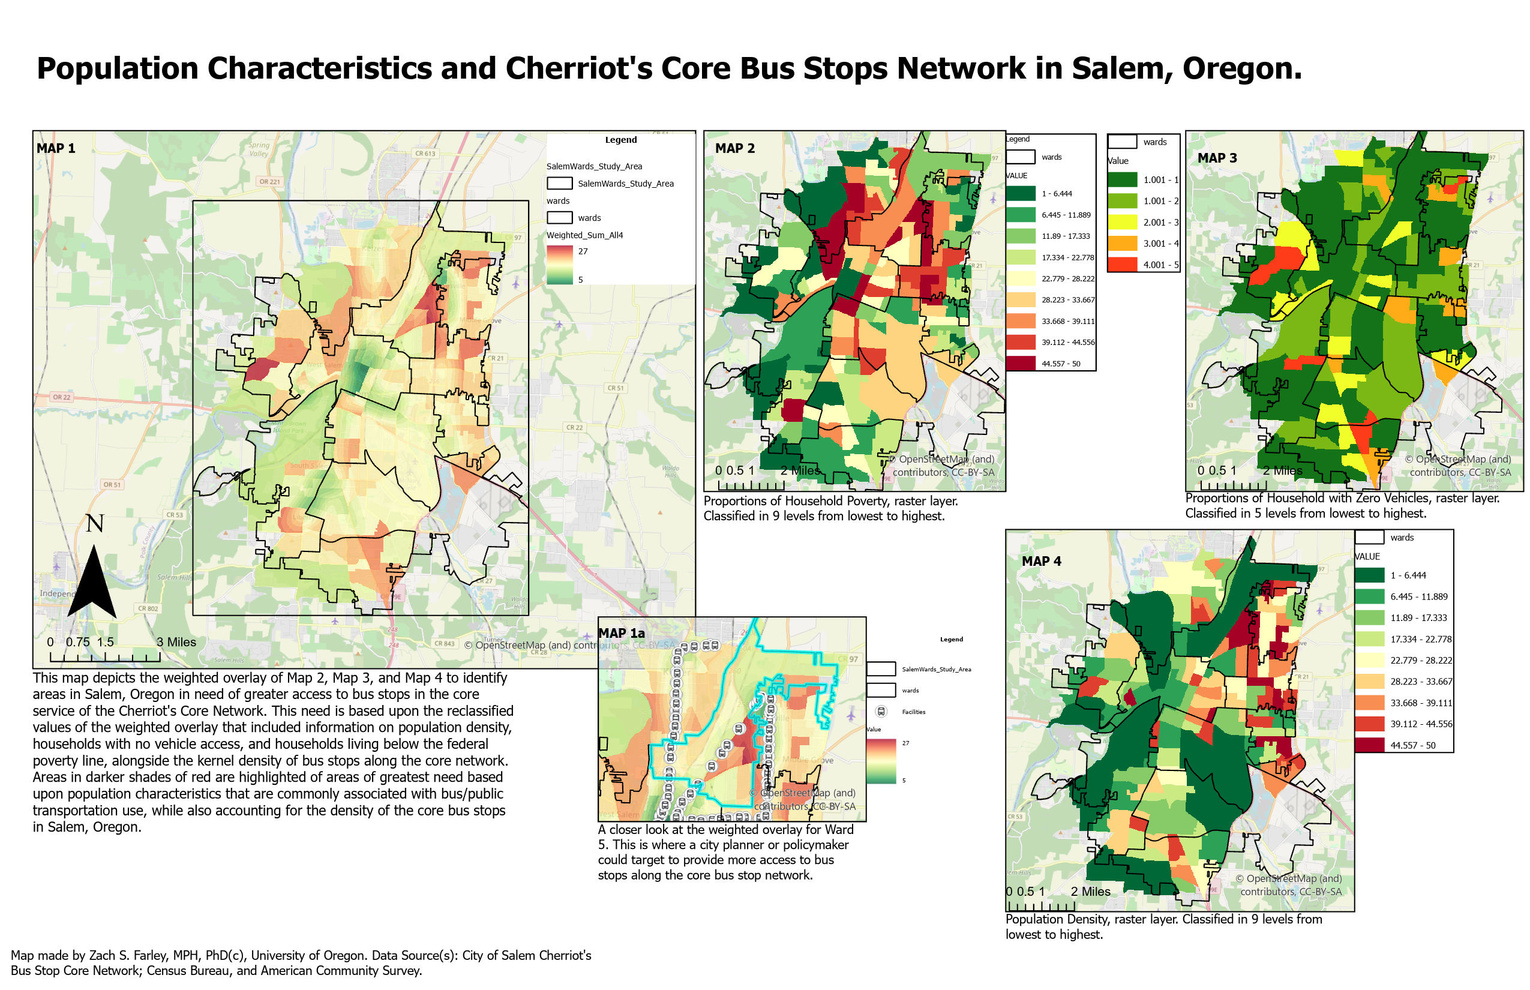
Characteristics of the Judson Middle School Service Area in Salem, Oregon

0
0.25
0.5
1 Miles
© OpenStreetMap (and) contributors, CC-BY-SA
Characteristics of the Judson Middle School Service Area (Salem, Oregon) are depicted to provide a better understanding about the environmental, population, and zoning/housing characteristics within a 4-minute, generalized, drive time.
Map made by Zach S. Farley, MPH, PhD(c), University of Oregon, on January 31, 2024. Data Source(s): City of Salem in conjunction with the SCYP AY2023 project; USCB - 2020 Census
Parks Within the Judson Middle School 4-Minute Drive- Time Service Area (Generalized) Boundary
PARK_NAME
ADDRESS
PARK_TYPE
Woodmansee Park Hilfiker Park Hillview Park Wendy Kroger Park200 Arlene Av SE
4629 Sunnyside Rd SECommunity Park
1350 Hilfiker Ln SE 502 Ewald Av SE
Neighborhood Park Neighborhood Park Neighborhood Park
Shape_Area
1332731.300779 82791.06977 157163.342098 300465.149557

Legend
middle_schools ParkBoundaries_Judson
JudsonSA_parcels
4Min_SA_Gen
CensusBlocks
Population (POP20) and Housing Units (HOUSING20) in the Judson Middle School 4-Minute Drive-Time Service Area (Generalized) Boundary
FacilityID BLOCKCE20 POP20 HOUSING20
4
1016
15734 6797
Publications


Posters

NIH SUMMER RESEARCH PROGRAM
Alcohol and Sunburn: A National Survey
Farley, Zach S. BS 1, Perna, Frank M. EdD PhD 1, Holman, Dawn M. MPH,
2
Berrigan, David PhD MPH 1, Eck, Raimee H. PhD MPH MPA CPH
1

1
Health Behaviors Research Branch, National Cancer Institute, Rockville, MD
2
Centers for Disease Control and Prevention, Division of Cancer Control, Atlanta, GA

Importance
•Skin cancer is the most prevalent cancer in the
United States 1
•
In 2016, 82,476 new cases reported and
8,188 people died of Melanomas of the
skin1
Why Sunburn, Why Alcohol?
• •
•
Lifetime sunburn occurrence is the primary risk factor for melanoma 2 An individual’s history of alcohol use has been strongly and
consistently associated with their history of sunburn, and
significantly, to a lesser degree with Melanoma
In contrast to existing literature, this study looks at how
contemporaneous alcohol consumption is directly linked to
sunburn
Research Question What is the relative frequency of sunburn and
contemporaneous use of alcohol in a national sample
of US adults?
Hypothesis 1: Sunburn occurrence will be significantly associated with contemporaneous drinking.
Hypothesis 2: Adults reporting one instance of alcohol-
involved sunburn in the last 12 months will report a higher
number of sunburns.
Adults who reported a history of alcohol-involved sunburn were sunburned 50% more frequently than those who did not.
Alcohol-involved sunburn is more common amongst men.

Results
•Alcohol-involved sunburn in the last 12
months was significantly greater than 0 (6.9%), but not significantly more likely than expected in comparison to other
contexts. (i.e. 10% occurrence by
chance)
•Men (9.5%) were significantly more likely
to report alcohol-involved sunburn in the
last 12 months than women (4.4%)
(p<0.001)
•Young adults (18-34) (8.4%) were more
likely to report an alcohol-involved
sunburn in the last 12 months than older
adults (35+) (5.9%) p = 0.06
•Adults reporting an alcohol-involved
sunburn in the last 12 months averaged
significantly more sunburns (3.07, +/-.48)
than adults without (1.96, +/- .06), F (1,
1457) = 8.96, p < .001
•Men with a history of alcohol-involved
sunburn in the last 12 months had a
much higher average number of
sunburns (3.29) over 12 months versus
not (1.86) whereas mean number of
sunburns was not significantly different
among women (2.17, 2.03 respectively)

Conclusions
Overall, alcohol-involved sunburn does occur among a small, but not insignificant portion of adults sampled.
Adults reporting at least 1 alcohol-involved
sunburn in the last 12 months were sunburned
50% more frequently than those who did not.
•Sunburn and contemporaneous drinking was
•
•
more common amongst men
•Sunburn and contemporaneous drinking was
more common amongst young adults
•Common cooccurring events to alcohol-involved
sunburn include: Swimming, Travelling, Relaxing,
Physical activity, and Trying to get a tan

Other contexts among those reporting a history of sunburn & alcohol use
Materials and Methods
Number Among those
sunburned last 12
months (% of total)
= 1459)
Number among those co-
reporting alcohol-involved
Activity
(not mutually exclusive)
•
Data Source: CDC Summer Styles Survey 2018 (N = 4,088, age 18+) (Panel Survey by Porter Novelli)
(N sunburn when most recently
sunburned (%) (N = 93)
Measures
“During the past 12 months, how many times
have you had a sunburn?. . . ” “Think about the times you got sunburned in the
past 12 months. Were you doing any of the
following activities when you got burned?”
“The most recent time you got sunburned, were
you doing any of the following activities?”
Data Analysis
Working outside at your/friend Home
465 (31.9)
16 (17.2%)
Working outside at your job Traveling/Vacationing
Swimming/in water
PA other than swimming
At outdoor Event
Relaxing, reading…etc.
Trying to get a Tan
Drinking Alcohol
Other
Don’t Remember
203 (7.0) 399 (27.4)
600 (41.1)
381 (26.1)
347 (23.8)
246 (16.8)
153 (10.5)
101 (6.9)
54 (3.7)
29
2 (2.2%) 36 (38.7%)
53 (56.9%)
19 (20.4%)
16 (17.2%)
25 (26.9%)
18 (19.4%)
•
Descriptive Statistics and Chi-Square to
compare relative frequencies of responses
2 X 2 ANOVA (drinking by gender) compared
mean number of sunburns
•
3 (3.2%) 0 (0%)

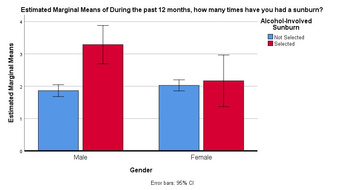
Male: Alcohol-Involved Sunburn (mean = 3.29 95% CI 2.69, 3.88); No Alcohol-Involved Sunburn (mean = 1.86 95% CI 1.68, 2.05 Female: Alcohol-Involved Sunburn (mean = 2.17 95% CI 1.37, 2.97); No Alcohol-Involved Sunburn (mean = 2.03 95% CI 1.86, 2.19)
Descriptives
•35.9% of valid respondents (1,459)
reported at least one sunburn over the
past 12 months
•Sunburn occurred equally amongst men
(36.5%) and women (35.3%) p < 0.001
•Younger adults (18-34 years old)
(47.6%) were more likely to have
reported a sunburn than older adults
(35+ years old) (31.0%) p < 0.001


References
1.
2.
USCS Data Visualizations - CDC. Centers for Disease Control and Prevention. https://gis.cdc.gov/Cancer/USCS/DataViz.html. Accessed July 29, 2019.
Dennis LK, Vanbeek MJ, Freeman LEB, Smith BJ, Dawson DV, Coughlin JA. Sunburns and
Risk of Cutaneous Melanoma: Does Age Matter? A Comprehensive Meta-Analysis. Annals of
Epidemiology. 2008;18(8):614-627. doi:10.1016/j.annepidem.2008.04.006.
3.Darvin M, Sterry W, Lademann J, Patzelt A. Alcohol Consumption Decreases the Protection
Efficiency of the Antioxidant Network and Increases the Risk of Sunburn in Human Skin. Skin
Pharmacology and Physiology. 2013;26(1):45-51. doi:10.1159/000343908.
4.Warthan MM, Sewell DS, Marlow RA, Warthan ML, Wagner RF. The Economic Impact of
Acute Sunburn. Archives of Dermatology. 2003;139(8). doi:10.1001/archderm.139.8.1003.
Acknowledgments
Summer Internship Program, National Institutes of Health, National Cancer Institute


Examining the Urban Walking Brain:
Promoting Restorative Environments
1,2
Farley, Z.,
1,3
Bailey, A.
Department of Health and Human Performance, University of Tennessee, Chattanooga TN 1 Master of Public Health Program 2 Sport, Outdoor Recreation and Tourism Management Program 3


Environment Influence
•
Engaging with components of nature has been shown to prompt restorative responses, even in urban settings
•
Decr. stress, anxiety, frustration; Incr. positive engagement, cognition, likelihood of PA engagement/achievement 4-6 Responses may be enhanced when PA is performed in the presence of
•
7
restorative spaces
•Previous research has shown that subtle changes in
components of urban design can influence an individual’s
perception and neurological response to their surrounding
environment and PA engagement 8,9
•
E.g. the more restorative components (green space, natural shade, water features, green walls, etc.) the better the outcomes
Theories Considered:
•
: Natural environments can
Attention Restoration Theory
engage involuntary attention allowing for recovery from mental/attention fatigue 6 Stress Reduction Theory: Natural environments can reduce physiological stress and aversive emotion 9
•
Purpose
•
We aim to add to the evidence-base concerning the efficacy of including restorative spaces in urban design to passively enhance population health outcomes—reduced stress and adverse mental health outcomes and improved PA engagement
•
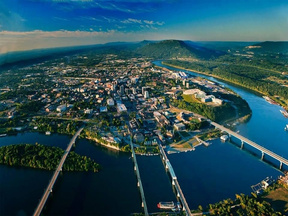
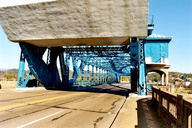
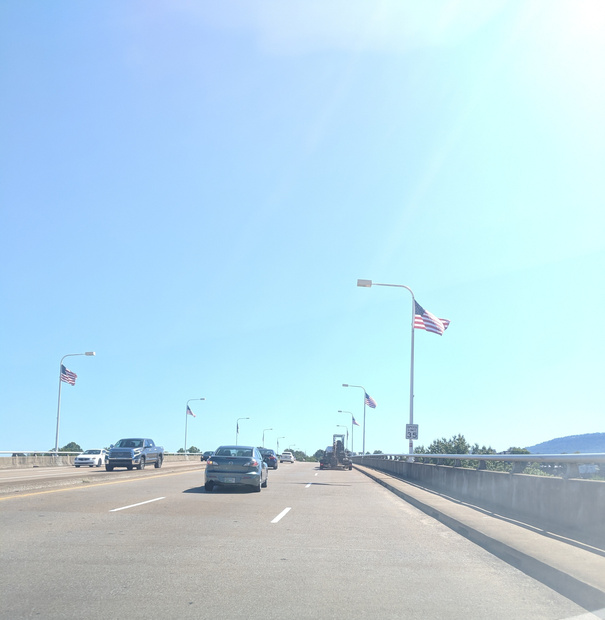
•Arrow 1 shows a park in North Chattanooga—
•
**High-volume open space within view of major urban characteristics versus green space with canopy cover (escape from the city)
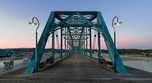
The three bridges (A, B, C). The pedestrian-only bridge (A) has the same general view as the other bridges (B, C), but induces more positive mental states (meditation) and less negative responses (anxiety).
despite being mostly green and open, which one would expect to be restorative, anxiety was the dominant mental state.
In contrast, arrow 2, which shows a park that is
close in proximity, participants mental state(s) were meditative dominant, indicating that subtle changes in an individual’s external environment can impact perception and mental state.


Preliminary Analysis
•
Data was Z-scored to account for measurement error and eliminate outliers ArcGIS used to provide visual representation of dominant mental states in response to location
•
Conclusions
•
•
Preliminary Results
•
•
•
•
See the bridge example above to understand/observe how subtle differences in the environment can influence how one perceives relative restoration
Components of the external environment had an observable impact on an individual’s (and the group’s) dominant mental state throughout the respective routes Objectively restorative spaces (water features, green space, etc.) induced positive mental state (Inward Attention, Motivation) Objectively urban characteristics (high traffic, oppressive design, noise) induced negative mental state (Focus, Anxiety)
•
Next Steps
•
Quantify the results using ArcGIS Spatial Analysis

Background
•
•
•
•
1
individuals
Regular PA (walking) has been shown to mitigate stress and
resulting psychophysiological outcomes 3
•
However, components of an individual’s external environment may influence the net outcome of PA benefit on health
•
•
•
•
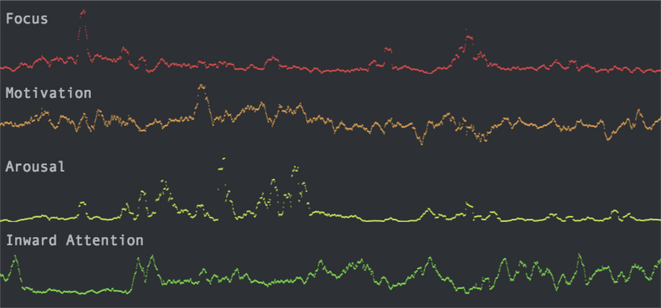
Focus: a general measure of mental engagement evidenced by Beta activity in frontal lobe10 Approach Motivation: absence of Alpha Activity in left frontal lobe (frontal asymmetry)—related to high levels of arousal which may indicate + emotion (e.g. happiness, excitement) but could also indicate aggression or anger11 Arousal/Anxiety: high-Beta and Gamma waves in temporal and parietal lobes—commonly associated with tunnel vision and lower long-term performance11 Inward Attention/Meditative State: indicated by Theta waves in frontal and temporal lobes coupled with Alpha waves in the posterior –associated with daydreaming or meditative experiences12
Methods
•
Convenience sample (n=33) of students at the University of Tennessee at Chattanooga in health science courses that encourage active research participation Students were randomly assigned to an approximately 30-minute walking route (daily PA recommendation) in downtown Chattanooga, TN while wearing mobile EEG and activity band (GPS) An iPhone with a custom application used to merge data was carried by all participants
•
•
•
To control for variables, collection occurred at the same time of day, under similar weather conditions
•
Urban social & structural characteristics subdue inhabitants to low-grade stressors requiring directed attention (poverty, traffic noise, oppressive design) resulting in ego-depletion (limiting cognitive capacity) 1
Cumulative effects of persistent low-grade stressors may have a greater influence on overall health status than acute, intense health events 2 As a result, urban-dwellers experience higher levels of stress and are 20-40% more likely to experience anxiety and/or mood disorders than non-urban
Mapping of Dominant Mental States: Chattanooga, TN
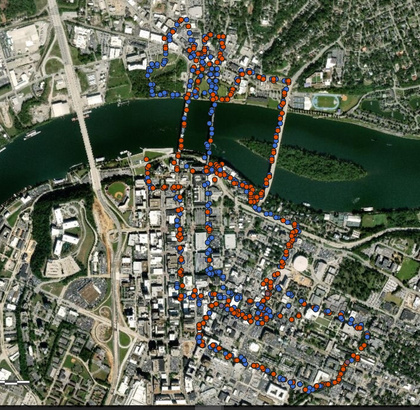


Dominant Mental
State
Meditative (Positive)
Anxiety (Negative)
Individual differences in mental state were accounted for by establishing baseline (EEG, HR, HRI) prior to beginning walking route (2018 political ads) and normalizing the data during analysis
Measures and Interpretation
•
EMOTIV Insight EEG: Mental State
•
•
•
•
•
Microsoft Band: GPS location and HR, HRI collection in real time
•
Data collected is displayed alongside brainwave measures to illustrate affect and/or association between location and measures
iPhone: Compiles all data with time points
•
Custom app created to allow compilation of data
into csv file for conversion into an illustrated data
set (seen above)
•
Allows for visual mapping and analysis of
external environment impact on outputs
Implications for urban planning and mental health are evident. Areas with low traffic, better views, more green space, and more canopy cover induce a more positive mental
state (meditative state), whereas construction, traffic, and
distraction induce negative mental states (anxiety). Subtle changes in urban deign (inclusion of restorative spaces/features) can mitigate negative responses
Delta (.5-3Hz) and Theta Waves (4-7Hz): Associated with less intense brain functions (sleep, meditation, daydreaming) Alpha Waves (8-15Hz): Relaxed brain ready for action (walking/running induced relaxed states of mind Beta (16-31Hz) and Gamma Waves (32-100Hz): Associated with greater mental loads (concentration, stress, anxiety)
References 1.GruebnerO, Rapp MA, AdliM, Kluge U, Galea S, Heinz A. Cities and Mental Health. DtschArzteblInt. 2017;114(8):121–127. doi:10.3238/arztebl.2017.0121 2.McGonagle, K.A., and R.C. Kessler. 1990. Chronic Stress, Acute Stress, and Depressive Symptoms. American Journal of Community Psychology 18, 5:681-706. 3.Childs E, de Wit H. Regular exercise is associated with emotional resilience to acute stress in healthy adults. Front Physiol. 2014;5:161. Published 2014 May 1. doi:10.3389/fphys.2014.00161
4.Aspinall, P., Mavros, P., Coyne, R., & Roe, J. (2015). The urban brain: Analysingoutdoor physical activity with mobile EEG. British Journal of Sports Medicine,
49(4), 272–276. doi: 10.1136/bjsports-2012-091877
5.Bailey AW, Allen G, Herndon J, DemastusC. Cognitive benefits of walking in natural versus built environments. World Leisure Journal. 2018;60(4):293-305. doi:10.1080/16078055.2018.1445025. 6.Kaplan R., Kaplan S. The Experience of Nature: A Psychological Perspective. Cambridge University Press; Cambridge, UK: 1989.
7.FochtBC: Brief walks in outdoor and laboratory environments: effects on affective responses, enjoyment, and intentions to walk forexercise. Res Q Exercise
Sport 2009, 80(3):611–620.
8.KarmanovD., Hamel R. Assessing the restorative potential of contemporary urban environment(s): Beyond the nature versusurban dichotomy. Landsc. Urban
Plan. 2008;86:115–125. doi: 10.1016/j.landurbplan.2008.01.004.
9.Ulrich, R.S., R.F. Simons, B.D. Losito, E. Fiorito, M.A. Miles, and M. Zelson. 1991. Stress Recovery During Exposure to Natural and Urban Environments. Journal
of Environmental Psychology 11, 3:201-230.
10.Coelli, S., Sclocco, R., Barbieri, R., Reni, G., Zucca, C., & Bianchi, A. M. (2015). EEG-based index for engagement level monitoring during sustained attention
(pp. 1512–1515). IEEE. https://doi.org/10.1109/EMBC.2015.7318658
11.Harmon-Jones E., Gable P. A., Peterson C. K. (2010). The role of asymmetric frontal cortical activity in emotion-related phenomena: a review and update. Biol.
Psychol. 84, 451–462. 10.1016/j.biopsycho.2009.08.010
12.Lagopoulos, J., Xu, J., Rasmussen, I., Vik, A., Malhi, G. S., Eliassen, C. F., … Ellingsen, Ø. (2009). Increased theta and alpha EEG activity during nondirective
meditation. Journal of Alternative and Complementary Medicine (New York, N.Y.), 15(11), 1187–1192. https://doi.org/10.1089/acm.2009.0113

Scan here to access the poster and previous research

Acknowledgements
This work would not have been possible without the financial support of the UTC graduate assistantship program, the faculty and staff in the Health and Human Performance Department at UTC, and the guidance of my mentor (co-author), Dr.
Andrew Bailey.
https://sites.google.com/mocs.utc.edu/brainwaveproject
UTC Public Health Program College of Health, Education, and Professional
Studies
University of Tennessee at Chattanooga
utc.edu/mph